What if you could harness the power of your personal health data to make smarter, more impactful decisions about your well-being without doctor visits? Thanks to the combination of Apple HealthKit and Databricks, it’s now possible to create a comprehensive, data-driven approach to tracking and achieving your health and fitness goals. By leveraging big data analytics, machine learning, and robust dashboards, anyone can transform raw health metrics into actionable insights.
Building a Data-Driven Fitness Journey
The journey starts with understanding the value of centralizing health data. Devices and apps like Apple HealthKit collect a wealth of information—steps, heart rate, sleep patterns, and more—all in one place. But to truly capitalize on this data, you need advanced analytics and visualization tools. Databricks’ Lakehouse architecture provides an integrated platform, merging the best of data warehousing and data lakes. This allows users to efficiently process, analyze, and visualize large volumes of health data, all while maintaining governance and flexibility.
From Data Export to Cloud Storage
The process begins by exporting your health data from Apple HealthKit. This can be done directly through the app, resulting in an export.zip file that contains multiple datasets (such as XML, CSV, and GPX files). Uploading this file to cloud storage, like Google Drive, ensures easy access and sharing for downstream analytics. It’s important to verify file permissions and confirm the data is ready for processing.
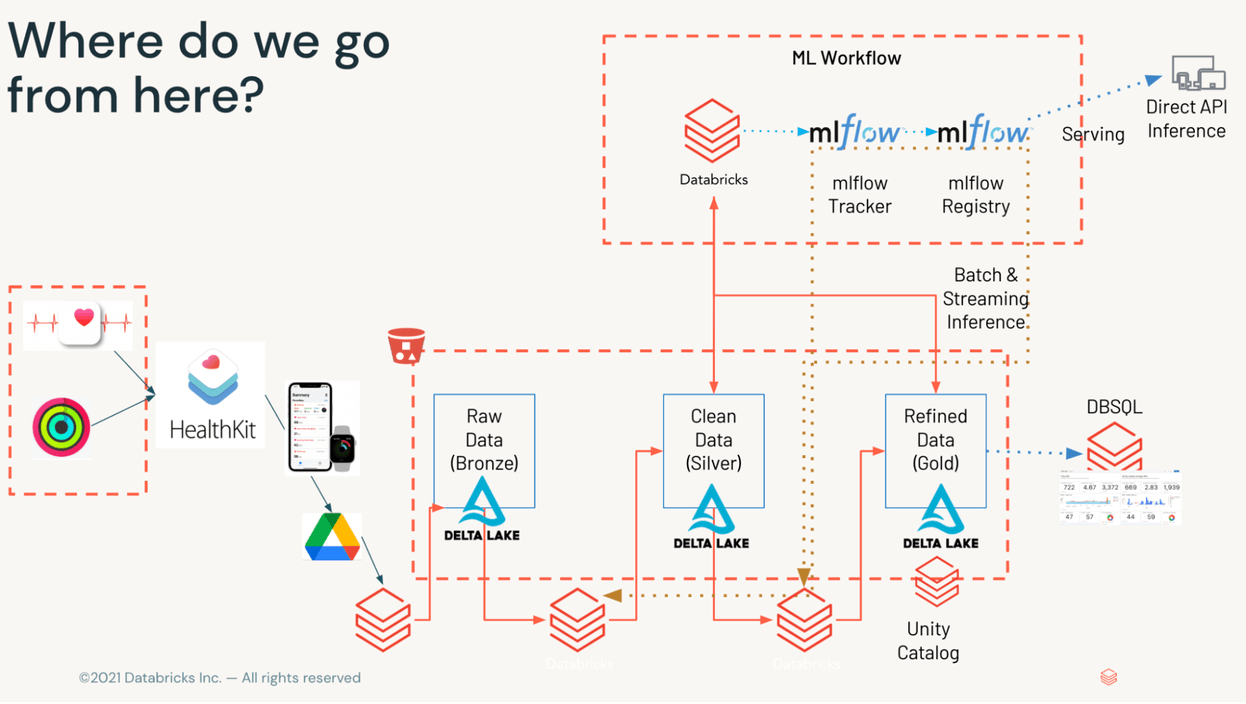
As shown in Figure 1, our data will make several stops along the way to visualization. Once data is available on object storage, we'll process it through the Medallion framework – taking raw XML (bronze), breaking out disparate datasets (silver), and aggregating relevant KPIs on minute, hourly, and daily basis to present to the serving tier (gold). Credit: Databricks
Orchestrating Data Pipelines with Databricks
Once the data is in the cloud, Databricks comes into play. The platform uses tools like Apache Spark and Delta Live Tables (DLT) to automate the extraction, transformation, and loading (ETL) of health data. The Medallion architecture divides processing into three layers:
- Bronze: Raw data ingestion (e.g., Apple HealthKit’s XML export)
- Silver: Data cleaning, transformation, and classification into individual metrics
- Gold: Aggregation and KPI calculation for actionable insights
DLT provides a declarative approach to pipeline management, automating tasks like data validation, scaling, and observability, ensuring data quality at every stage.
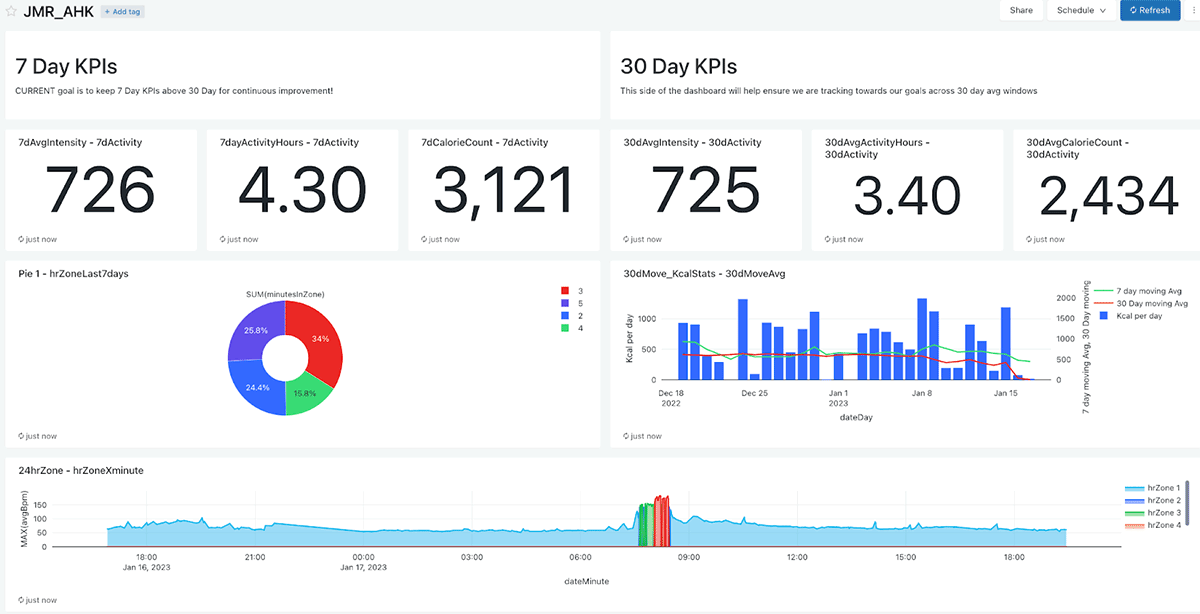
Above is a simple dashboard with relevant metrics, split by 7 day and 30 day averages. I like getting a view across KPIs and time all in a single dashboard. This will help guide my activity program to ensure I continuously improve! Credit: Databricks
Exploring and Transforming Health Data
With 55+ unique metrics tracked by Apple HealthKit, the dataset is rich but complex. Tools such as Bamboolib enable low-code exploratory data analysis, allowing users to quickly visualize, clean, and aggregate data. Data quality is a priority, DLT expectations can flag anomalies (like implausible heart rates) and take corrective actions automatically.
A metadata-driven ETL framework simplifies handling the diverse range of health metrics. By structuring transformations based on a metadata table, new metrics can be seamlessly added, and data can be modularized for both machine learning and business intelligence applications.
Building Dashboards and Driving Action
Once the data is curated and cleaned, the next step is visualization. Using Databricks SQL, users can build dashboards that track key performance indicators (KPIs) such as workout time, heart rate variability, and trends over weekly and monthly periods. These dashboards provide a holistic view of progress, motivating users to stay on track and adjust their routines as needed. Databricks also integrates with visualization tools like Power BI and Tableau for enhanced reporting.
Leveraging Machine Learning for Deeper Insights
Beyond dashboards, the cleaned health datasets can fuel machine learning models. Databricks’ AutoML makes it easy to build and deploy models for forecasting and trend analysis, such as predicting weight loss based on historical KPIs. MLflow integration ensures experiments are tracked and reproducible, even for users without a data science background.
Takeaway: Empower Your Health with Data
This hands-on experiment demonstrates that anyone can unlock the power of their personal health data. By combining Apple HealthKit’s robust data collection with Databricks’ scalable analytics and visualization capabilities, users can monitor, understand, and improve their health outcomes. The process is approachable, customizable, and ready for you to start your own data-driven wellness journey.
Source: Databricks Blog by Jesus Rodriguez
Github: https://github.com/jesusr-db/db-ahk

Transforming Personal Health Tracking with Apple HealthKit and Databricks