When a doctor takes a biopsy, that tissue sample is typically stained with a simple, inexpensive method that has been used for over a century called H&E. This gives a basic, "black-and-white" view of the tissue's structure, allowing pathologists to identify cells and diagnose diseases like cancer. While useful, it's limited; it can't show what's happening on a molecular level, such as identifying the specific types of immune cells present.
For that deeper look, scientists use a powerful but expensive and time-consuming technique called multiplex immunofluorescence (mIF). Think of this as a highly detailed, multi-colored "molecular map" that lights up dozens of specific proteins, revealing the intricate interactions between different cells. This detailed map is crucial for modern medical research, especially in understanding how the immune system fights cancer.
Here we introduce ROSIE, a powerful AI that has been trained to look at a simple, inexpensive H&E-stained image and computationally generate the detailed, multi-colored molecular map.
The authors from Enable Medicine, Stanford University and the University of Chicago trained a deep learning model to predict pixel-level expression for 50 protein biomarkers directly from hematoxylin and eosin (H&E) images, using co-stained datasets where H&E and multiplex immunofluorescence (mIF, specifically CODEX) are aligned on the same tissue section.
In short, ROSIE acts like a computational microscope, revealing a hidden world of molecular detail within standard medical images and paving the way for more powerful diagnostics and research.
Key Takeaways
- Paired, co-stained data at scale: over 1,300 samples and 16 million cells across diverse tissues enable supervised learning from H&E to mIF.
- Simple patch-to-patch regression works: a ConvNeXt CNN trained with a mean squared error objective predicts the mean expression of the center 8×8 region from a 128×128 H&E patch, then stitches predictions into whole-slide mIF images.
- Measured accuracy on held-out sets: average Pearson R 0.285, Spearman R 0.352, and sample-level C-index 0.706 across 50 biomarkers; baselines using raw H&E intensity or morphology features perform near chance.
- Generalizes beyond training sites: comparable rank-based performance on studies and diseases not seen in training (e.g., colorectal and gastroesophageal junction cohorts).
- Biological utility: ROSIE outputs support cell phenotyping, tissue structure discovery, and neighborhood analyses like tumor-infiltrating lymphocytes.
- Quality heuristics help: dynamic range and a histogram-based Wasserstein distance correlate with prediction reliability and can filter weaker outputs.
What ROSIE sets out to answer
H&E is clinical routine: cheap, fast, and ubiquitous. Multiplex immunofluorescence panels like CODEX resolve dozens of proteins in situ but are expensive and not widely adopted in clinical labs. The central question is how much molecular signal is latent in H&E morphology and whether a model can recover spatially resolved biomarker maps without running mIF on every specimen.
ROSIE addresses this with co-stained, same-section data to supervise learning from H&E to mIF. By predicting many proteins at once and validating on unseen cohorts, the study aims to show that in silico staining is not only visually plausible but also quantitatively useful for downstream biology and clinical research.
Approach at a glance
ROSIE uses a ConvNeXt backbone (Liu et al., 2022). Training operates on paired patches: given a 128×128 H&E tile, the network regresses a 50-length vector representing mean expression across the central 8×8 region in the aligned CODEX data. Sliding this window at 8-pixel steps yields a contiguous predicted volume at 8× downsampling, with an option to run at 1-pixel stride for native resolution visualizations. The model is optimized with a single masked mean squared error loss to handle study-specific panels where some biomarkers are absent.
Although Vision Transformers are prominent in pathology, the authors report ConvNeXt outperforming several ViT variants in this task. They also compare against GAN-based pix2pix training and find it underperforms, aligning with well-known training instability and limited biological calibration for adversarial objectives (Isola et al., 2017) and foundational ViT work (Dosovitskiy et al., 2021).
Why it matters
If robust, in silico staining could reduce costs, shorten turnaround times, and enable screening on existing H&E slides. That would help triage who needs full mIF, prioritize cases for specific biomarker assays, and open analyses for biobanks that only have H&E.
For resource-constrained settings, it offers a way to approximate spatial proteomics without specialized instruments. Importantly, the authors do not position ROSIE as a replacement for a full 50-plex experiment but as a tool to augment H&E with actionable molecular signals.
The implications of this technology are significant:
- Unlocking a Treasure Trove of Data: Hospitals and labs around the world have vast archives of H&E-stained slides. ROSIE could be used to go back and analyze these existing samples, extracting new and valuable molecular data without any new lab work.
- Reducing Costs and Time: It allows researchers and clinicians to get the benefits of a sophisticated molecular analysis from a cheap, fast, and routine test. This could make advanced diagnostics more accessible, especially in resource-limited settings.
- Advancing Cancer Research: ROSIE can accurately identify different types of immune cells and see how they are interacting with tumors. This is critical for developing and personalizing cancer immunotherapies, which work by helping the patient's own immune system fight the disease.
Discussion and What the Figures Show
So, what does this all mean for the future of medicine and research?
The study's authors highlight that their work begins to answer a major question: just how much molecular information is hidden within a standard H&E stain? The answer, it turns out, is a lot. This research demonstrates that the unrealized potential of H&E staining is enormous.
- High Accuracy: When compared to the "ground truth" expensive CODEX scans, ROSIE's predictions were highly accurate. The AI successfully generated images showing the location of 50 different protein biomarkers, achieving a strong correlation with the real measurements. This proves the AI isn't just guessing; it's genuinely identifying molecular patterns from the basic H&E image.
- Works on Unseen Data: In a crucial test of its real-world utility, ROSIE performed well on tissue samples from hospitals and for diseases it had never been trained on. This ability to generalize shows that the technology is robust and not just memorizing the data it learned from.
- Identifies Cells and Tissues: The predicted biomarkers weren't just pretty pictures; they were biologically useful. ROSIE was able to use its generated data to accurately identify different cell types, like distinguishing between crucial B and T immune cells, far better than other methods that rely on H&E images alone. It could even identify larger tissue structures and important cancer research features, like "tumor-infiltrating lymphocytes" (TILs), which are immune cells that have moved into a tumor to fight it.
- Built-in Quality Control: The team developed a simple but effective method to predict the quality of a generated image. This allows researchers to know which AI-generated stains are most reliable, filtering out lower-quality results that might occur due to variations in the original H&E slide.
ROSIE offers a powerful way to unlock this potential, providing several key advantages:
- Democratizing Advanced Diagnostics: It can provide rich, molecular-level insights without the need for expensive equipment and time-consuming procedures. This could make advanced biomarker analysis more accessible in clinics worldwide, especially in resource-limited settings.
- A Powerful Screening Tool: Clinicians could use existing H&E slides to screen patients, for instance, to predict who might respond best to a particular therapy. This could speed up clinical workflows and help prioritize patients for more complex testing.
- Rethinking AI Models: Interestingly, the researchers found that their relatively simple and small AI model (a CNN) outperformed much larger, more complex "foundation models." This suggests that for specific tasks like this, a tailored approach can be more effective and computationally efficient.
While acknowledging limitations, such as the need for more testing on data from different labs and imaging platforms, the researchers are optimistic. They believe that with further validation, in silico (computationally generated) staining with tools like ROSIE could become a transformative part of clinical decision-making.
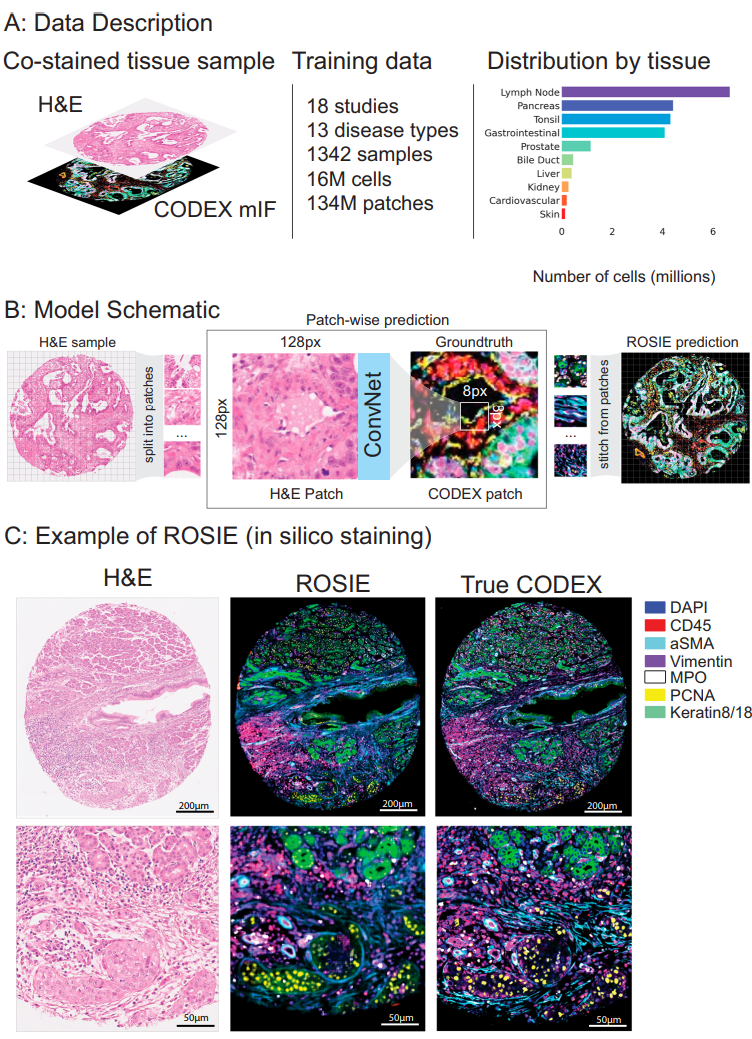
Fig. 1 | Overview of ROSIE. A Our training dataset consists of 18 studies and over 16 M cells. Each tissue sample is co-stained with H&E and CODEX. 16 disease types and 10 body areas are represented in this dataset. The overall distribution of represented tissue types across training and evaluation datasets is shown on the right. B A schematic of model training and inference is shown. Given an H&E sample, the image is split into patches of size 128px by 128px. The model is trained to predict the average expressions of the center 8px by 8px patch in the corresponding CODEX image. After the model is trained, a predicted CODEX image is generated by aggregating all of the generated patches into a single image. C Given an H&E-stained image, ROSIE predicts the pixel-level expression of 50 biomarkers. An exemplary image (with the highest Pearson R score) is visualized, where seven representative biomarkers are colored and shown alongside the true CODEX image. While the generated images used in our analyses are produced with 8px striding, this image is produced using 1px striding for greater visual clarity. Credit: Wu et al.
Figure 1 summarizes the dataset and workflow. The training corpus spans 18 studies and over 16 million cells, with 10 body areas and 16 disease types represented. The patching scheme is depicted: 128×128 H&E in, average expression over the central 8×8 out, stitched to form a predicted CODEX image. The paper illustrates seven representative biomarkers and shows a high-correlation example.
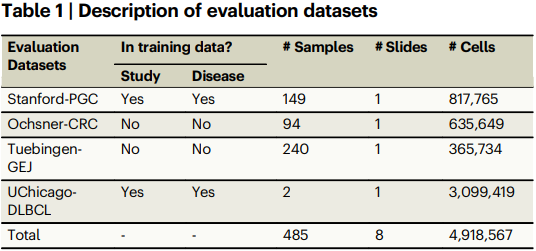
Tables 1–2 describe the four evaluation datasets and report the core metrics. On the primary Stanford-PGC dataset and three additional cohorts, ROSIE achieves mean Pearson R 0.285, Spearman R 0.352, and a sample-level C-index of 0.706 across 50 biomarkers, outperforming H&E intensity and morphology-based baselines.
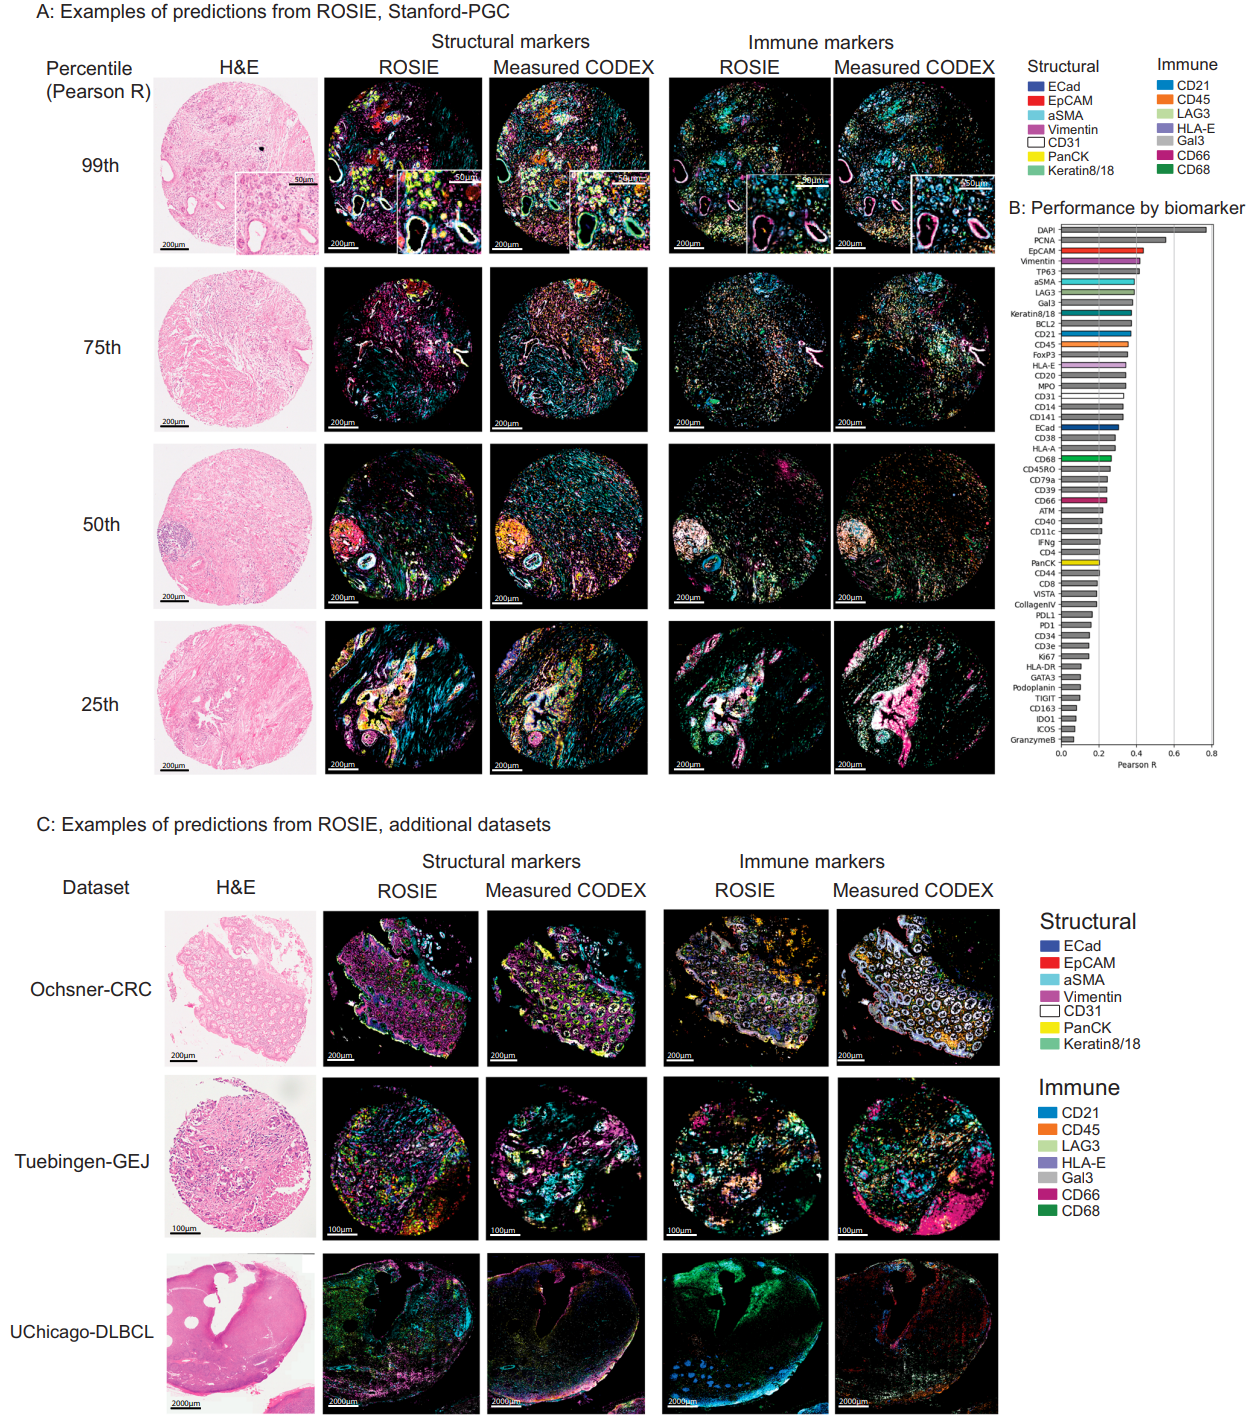
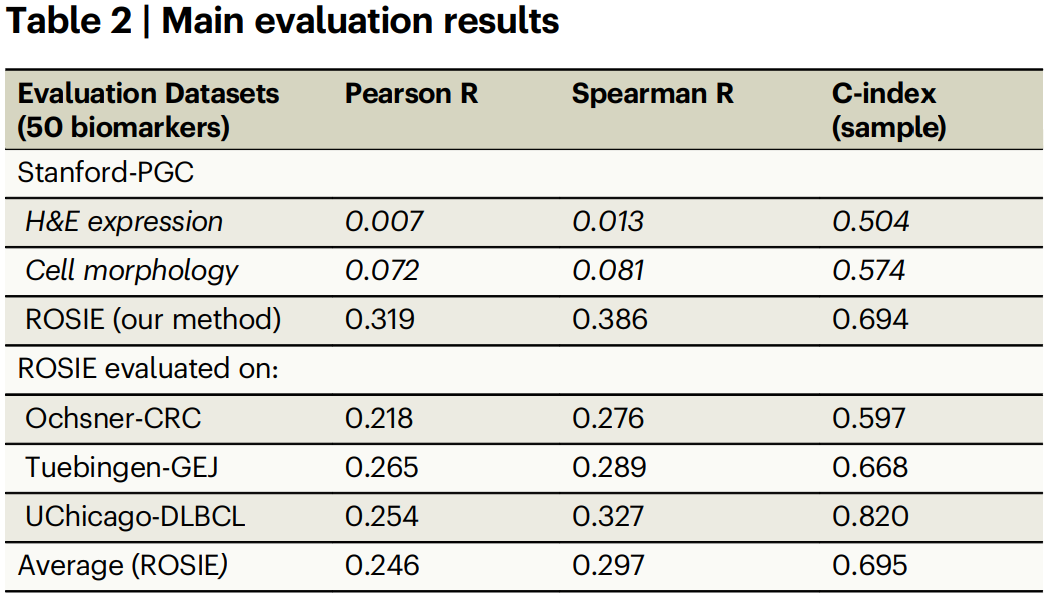
Figure 2 provides side-by-side predicted and measured CODEX images across percentiles of performance, plus a per-biomarker Pearson plot over all 50 targets. Visualizations show ROSIE recapitulating salient structural and immune markers across diverse samples, including median examples from colorectal cancer, gastroesophageal junction, and diffuse large B-cell lymphoma cohorts.
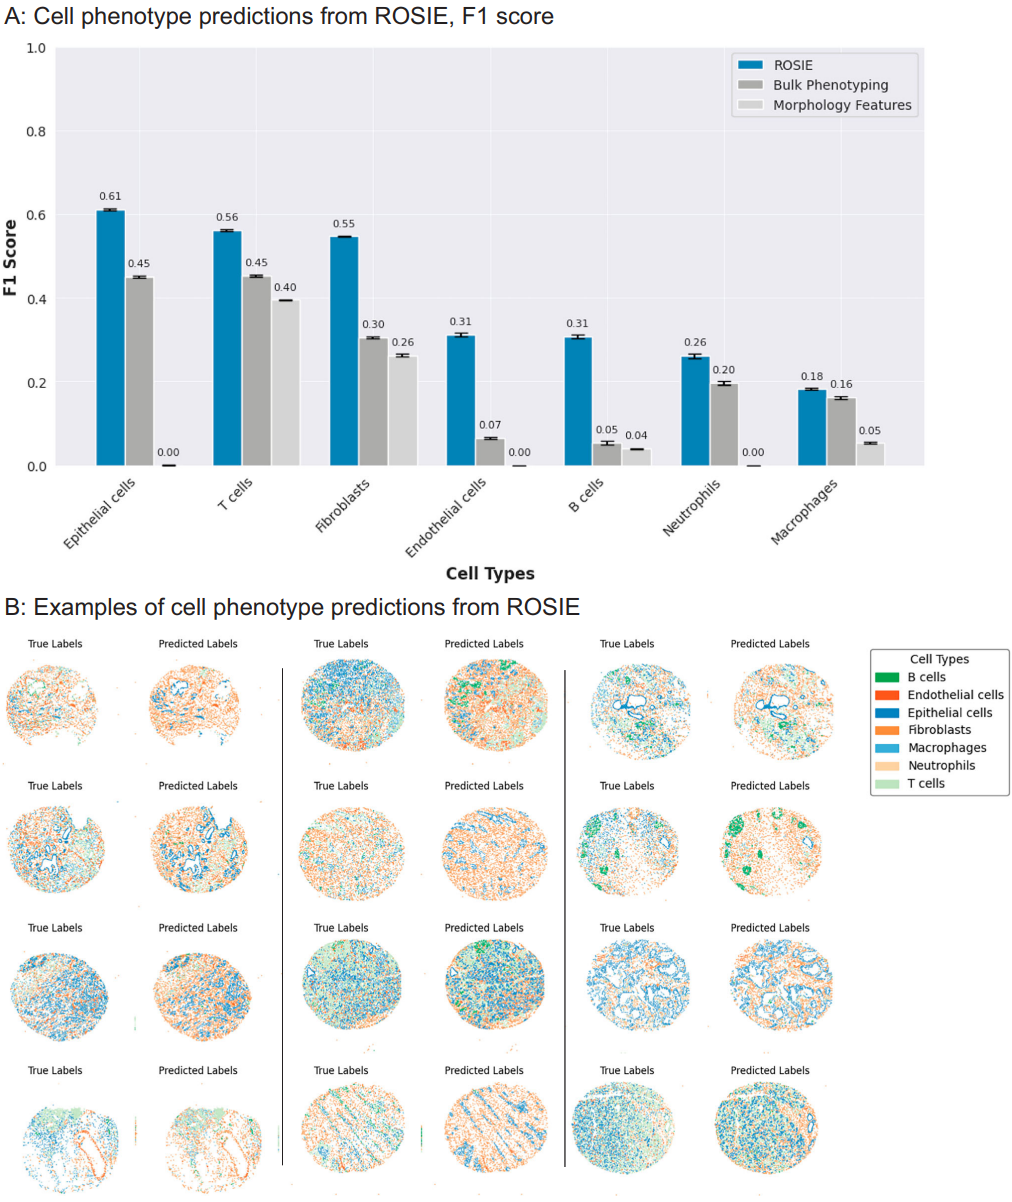
Fig. 3 | Cell type predictions using ROSIE. A F1 scores (N = 817,765 cells) on the primary Stanford-PGC dataset, comparing the performance of ROSIE to two baselines: bulk phenotyping, which randomly assigns cell types based on sample-level cell type proportions, and morphology features, which uses a three-layer neural network to classify cells based on morphology features and the H&E RGB channels. Data are presented as mean values with error bars as the 95% bootstrapped confidence intervals. B Visualization of cell phenotype predictions from twelve median samples by Pearson R Credit: Wu et al.
Figure 3 evaluates cell phenotyping. Using a nearest-neighbor classifier trained on measured expressions and then applied to ROSIE outputs, the model achieves better F1 scores than morphology and bulk-proportion baselines on seven cell classes (B, T, epithelial, endothelial, fibroblasts, macrophages, neutrophils). On Stanford-PGC, average F1 is 0.507; on the colorectal cohort, it is 0.411.
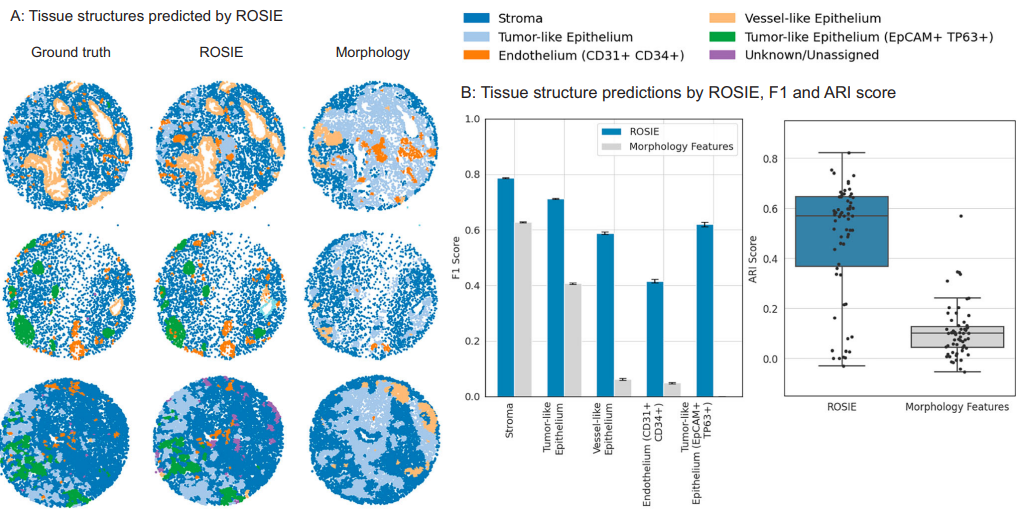
Fig. 4 | Tissue structure discovery by ROSIE. Discovery of tissue structures using biomarkers generated by ROSIE on the Stanford-PGC test dataset. Five tissue structures are identified using a graph partitioning algorithm that clusters cells based on their expression profiles and neighboring cells. This algorithm is performed on both the ground truth measured and ROSIE-generated biomarker expressions and then reconciled to a common label set. A Visualizes several representative samples of tissue structures discovered using the ground truth CODEX measurements, ROSIE-generated expressions, and the morphology baseline method. B Left: We report the F1 score (N = 635,649 cells) by comparing the structures discovered using ground truth, ROSIE-generated biomarkers, and morphology features. Data are presented as mean values with error bars as the 95% bootstrapped confidence intervals. Right: ARI score is also reported by comparing the unlabeled discovered clusters, where each dot is a sample. Box plots show the median (center line), 25th and 75th percentiles (box edges), and the minimum and maximum values. Credit: Wu et al.
Figure 4 tackles tissue structure discovery using SCGP graph partitioning. Clustering cells by neighborhood and expression yields structures that match ground truth with average ARI 0.475 and F1 0.624, substantially above the morphology baseline (ARI 0.105, F1 0.229).
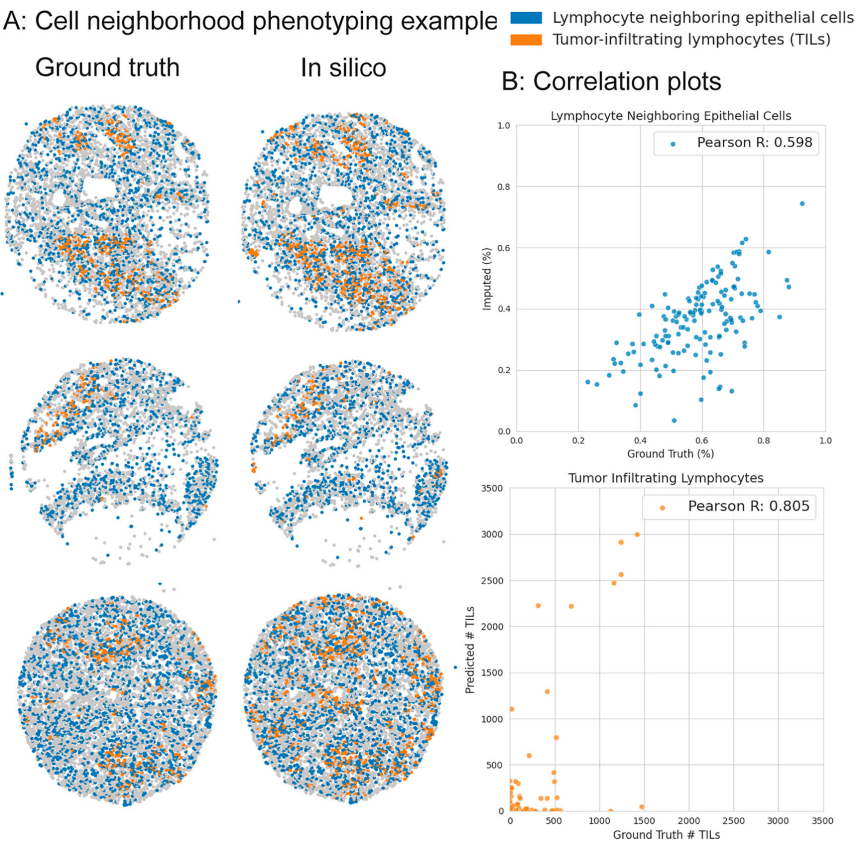
Fig. 5 | Cell neighborhood phenotyping by ROSIE. We identify two cellular neighborhood phenotypes of interest: tumor-infiltrating lymphocytes (TILs) and lymphocyte neighboring epithelial cells (LNEs). TILs are defined as cells that are labeled as lymphocytes (B and T cells) and reside in epithelial tissue (using the graph partitioning algorithm). LNEs are epithelial cells that have at least one lymphocyte as a neighbor. TILs are measured as the raw count per sample, whereas LNEs are measured as the proportion of epithelial cells with lymphocyte neighbors. A We visualize three samples (by median Pearson R) of TILs and LNEs based on ground truth-derived and ROSIE-predicted expressions. B Scatter plots of predicted and ground truth measurements, where each dot represents a sample. Credit: Wu et al.
Figure 5 analyzes cell neighborhoods. Predicted tumor-infiltrating lymphocytes and lymphocyte-neighboring epithelial cells correlate with ground truth across samples (Pearson R 0.805 and 0.598; Spearman R 0.329 and 0.575), indicating that neighborhood-level signals are preserved well enough for ranking tasks.
Evaluation and Generalization
Performance is not uniform across biomarkers, which is expected given stain prevalence and visual distinctiveness. Still, rank-based metrics are consistently strong, and site transfer results on Ochsner-CRC and Tuebingen-GEJ show Pearson R 0.241, Spearman R 0.283, and C-index 0.633 on average, close to the primary cohort. A small validation on an Orion mIF dataset highlights mixed transfer across platforms, with some markers remaining robust and others, like E-cadherin, lagging.
Two practical quality filters stand out. First, dynamic range: low spread between the 1st and 99th percentiles is associated with weaker predictions. Second, a simple Wasserstein-1 distance between a test H&E histogram and the training histograms flags out-of-distribution inputs. Using median cutoffs, average Pearson R improved from 0.285 to 0.312 with the histogram filter and to 0.336 with the dynamic-range filter.
Interpretability
The team uses Grad-CAM to visualize which pixels drive predictions (Selvaraju et al., 2017). For nuclear-localized proteins such as DAPI, Ki67, and PCNA, saliency concentrates near patch centers. For context-sensitive markers like PanCK or E-cadherin, saliency diffuses into the local neighborhood, matching intuition that microenvironment cues matter for those proteins.
Definitions and data pipeline
CODEX refers to a cyclic, multiplexed immunofluorescence workflow that conjugates barcoded oligos to antibodies and images them in rounds on platforms like Akoya PhenoCycler.
It is how the ground truth protein maps were obtained in this study (Akoya Biosciences, 2025). The authors perform H&E and CODEX on the same section, align them via feature matching (SIFT and RANSAC), and construct masked losses to ignore biomarkers not present in a given study. Training uses augmentations on 128×128 tiles and evaluates with Pearson correlation across patches and SSIM on reconstructed images.
Limitations and trade-offs
Registration artifacts, stain variability, and panel imbalance introduce noise. Some biomarkers are rare in training and are predicted poorly. The 128×128-to-8×8 design limits the context window to roughly a few dozen cells at 40×, which may be insufficient for certain microenvironmental dependencies.
Cross-platform generalization is imperfect, as seen with the Orion dataset. The authors emphasize that ROSIE is not a full substitute for multiplex assays: it enriches H&E with additional signal and is most compelling for ranking tasks, screening, and phenotyping where relative order matters more than absolute quantification.
What you can use it for today
- Retrospective studies that only have H&E can be re-analyzed with in silico biomarkers to explore cell type composition and neighborhoods.
- Triage large cohorts to select cases for targeted mIF or to prioritize immune-hot vs. immune-cold tissues for deeper study.
- Augment H&E-based cell classifiers with ROSIE expressions to improve separability of lymphocyte subsets and stromal vs. epithelial compartments.
Conclusion
ROSIE presents convincing evidence that routine H&E carries enough structural signal to infer many proteins at useful fidelity when trained on co-stained data. The method is simple, stable, and scalable: a CNN with an MSE loss, sliding windows, and masked targets. The paper shows real biological utility in cell typing, tissue structure discovery, and neighborhood analysis across multiple cohorts. Read the study and, if available, try reproducing the patch inference workflow on paired H&E and mIF data in your lab or institution.


From H&E to 50-plex Proteins: Inside ROSIE for in silico mIF
ROSIE: AI generation of multiplex immunofluorescence staining from histopathology images