The paper "Surpassing Cosine Similarity for Multidimensional Comparisons: Dimension Insensitive Euclidean Metric" interrogates a default choice in machine learning and information retrieval: cosine similarity.
The authors show how cosine similarity becomes dimension-dependent and loses interpretability as vector sizes rise, then introduce a Euclidean-distance-based alternative called the Dimension Insensitive Euclidean Metric (DIEM) that maintains stable variability across dimensions.
Key Takeaways
- Cosine similarity, a measure of orientation, converges toward fixed values as dimensionality grows (e.g.,
for random mixed-sign vectors), reducing its discriminative power in high-dimensional spaces. - This convergence is a consequence of the curse of dimensionality, where points in high-dimensional space become sparse and equidistant.
- The proposed Dimension Insensitive Euclidean Metric (DIEM) detrends the standard Euclidean distance by its expected value and variance, creating a stable, dimension-agnostic similarity score.
- For random vectors, DIEM’s distribution stabilizes and approximates a normal distribution for dimensions
, enabling the use of standard parametric statistical tests. - A case study using sentence embeddings (
) shows that while cosine similarity values collapse toward zero, DIEM remains informative and can distinguish between random and meaningful similarities.
The Curse of Dimensionality and Similarity Metrics
In machine learning, the "curse of dimensionality" refers to a set of phenomena that arise when analyzing data in high-dimensional spaces. As the number of features or dimensions grows, the volume of the space increases so rapidly that the data becomes sparse.
Consequently, the distance between any two points in a high-dimensional space tends to become uniform, making it difficult to distinguish between them. This phenomenon was first described by Richard Bellman in the context of dynamic programming ((Bellman, 1957)).
This poses a significant challenge for similarity-based algorithms like k-nearest neighbors (k-NN), clustering, and outlier detection. When all points are approximately equidistant, the concept of "neighborhood" or "closeness" loses its meaning.
The research here demonstrate that cosine similarity, despite being a popular choice, is not immune to this problem. As dimensions increase, the angle between two random vectors concentrates around 90 degrees, causing their cosine similarity to converge to zero. This makes it difficult to discern true similarity from statistical artifacts.
A Broader View on Similarity Metrics
Before diving deeper into DIEM, it's helpful to understand the landscape of similarity and distance metrics. While cosine similarity and Euclidean distance are common, many others exist, each with its own strengths and weaknesses.
- Manhattan Distance (L1 Norm): Also known as the "city block" distance, it measures the sum of the absolute differences between the coordinates of two vectors. It is less sensitive to outliers than Euclidean distance and is often used in grid-like or high-dimensional settings. The formula is
- Minkowski Distance: This is a generalized metric that includes both Euclidean and Manhattan distance as special cases. The formula is
- Jaccard Similarity: Used for comparing sets, it is defined as the size of the intersection divided by the size of the union of two sets:
- Mahalanobis Distance: This metric measures the distance between a point and a distribution. It accounts for the correlation between variables and is scale-invariant. It is particularly useful for detecting outliers in multivariate data.
The paper by Tessari et al. briefly explores Manhattan distance in its appendix, noting that its variance also grows with dimensionality, making it unsuitable for creating a dimension-insensitive metric in the same way as Euclidean distance.
Overview of DIEM
Cosine similarity measures the angle between two vectors, making it invariant to their magnitude. This property is useful for text analysis, where document length can vary, but it becomes problematic in high dimensions. The paper shows that as dimensionality increases, the cosine similarity of random vectors converges to a fixed value, effectively masking true similarities.
The authors' analysis reveals that while normalized Euclidean distance suffers from a similar issue, the unnormalized Euclidean distance,
To construct DIEM, the authors perform a statistical normalization. For vectors
The Math Behind DIEM Overview
The derivation of the expected distance
- LOTUS: This theorem allows us to calculate the expected value of a function of a random variable without knowing the function's probability distribution. For a random variable
- Jensen's Inequality: For a convex function
By applying these tools, the authors derive an analytical expression for the upper bound of
Why It Matters
High-dimensional comparisons are fundamental to many areas of science and engineering, including PCA loading comparisons, clustering diagnostics, model embedding analysis, and neuroscience synergy studies.
A metric whose variance collapses with dimensionality can lead to incorrect conclusions by overstating similarity or dissimilarity by chance. DIEM preserves discriminability across dimensions allowing for more reliable effect size estimation and supports rigorous hypothesis testing.
The trade-offs are clear: DIEM relies on unnormalized vectors and requires knowing or assuming a sensible range
However, for many applications involving physical signals, sensor data, or unnormalized embeddings, these assumptions are reasonable and DIEM offers a superior alternative to cosine similarity.
Analysis of Results and Future Directions
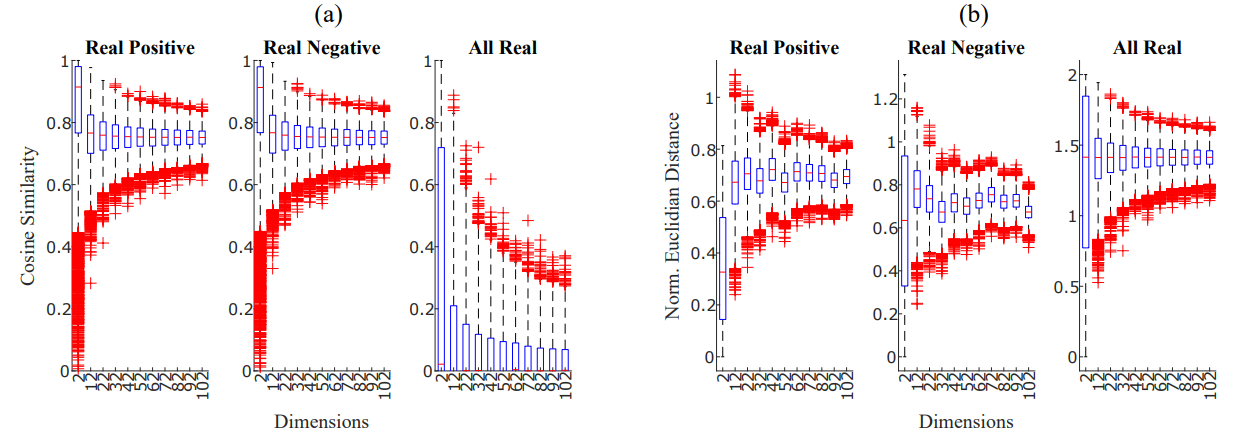
Figure 2: Panel (a): Cosine similarity boxplots for increasing dimension of the vectors a and b. Panel (b): Normalized Euclidean distance boxplots for increasing dimension of the vectors a and b. The three sub-panels show, respectively, the case in which vector elements were only positive (left), only negative (center) or could assume all real values within the given range (right).
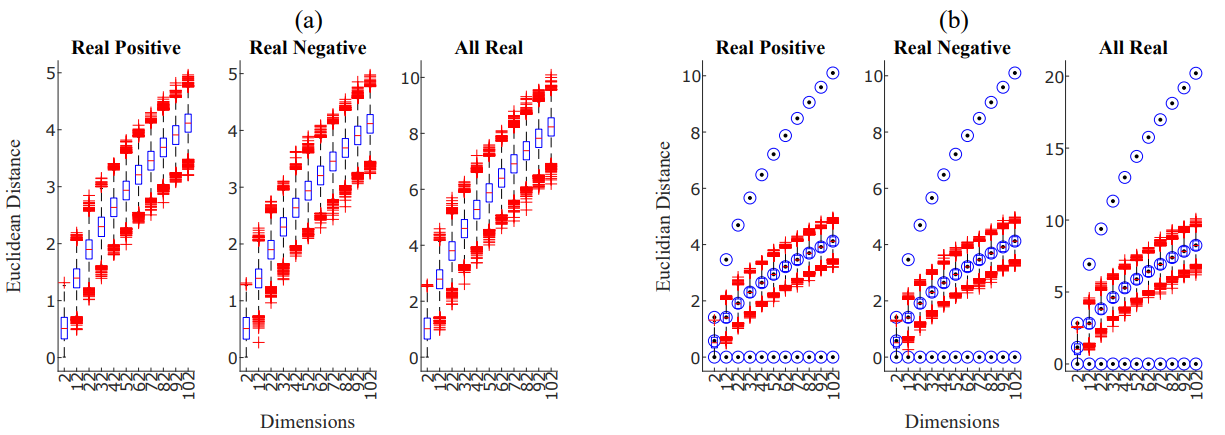
Figure 3: Panel (a): Euclidean distance for increasing dimension of the vectors a and b. The three sub-panels show, respectively, the case in which vectors elements were only positive (left), only negative (center) or could assume all real values within the given range (right). Panel (b): Euclidean distance for increasing dimension of the vectors a and b. The blue circles show the minimum, maximum and expected analytical Euclidean distance values.
The paper's results provide a clear and compelling narrative. Figures 2 and 3 are the cornerstone of the argument, visually demonstrating the failure of conventional metrics and the stability of the unnormalized Euclidean distance. Figure 2 shows the variance of cosine similarity and normalized Euclidean distance collapsing as dimensionality (
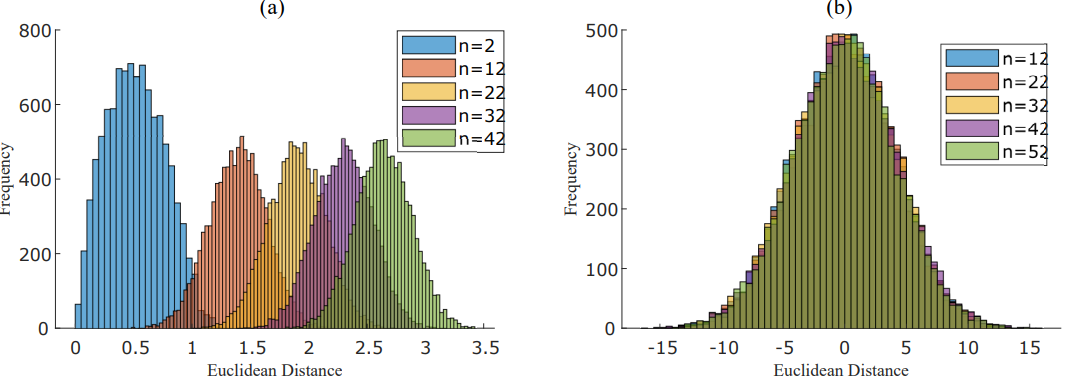
Figure 4: Panel (a): Histograms of the non-normalized Euclidean distance for growing dimensions ‘n’. Panel (b): Histograms of the detrended Euclidean distance for growing dimensions ‘n’.
The progression to Figure 4 reveals another powerful property: for dimensions as low as
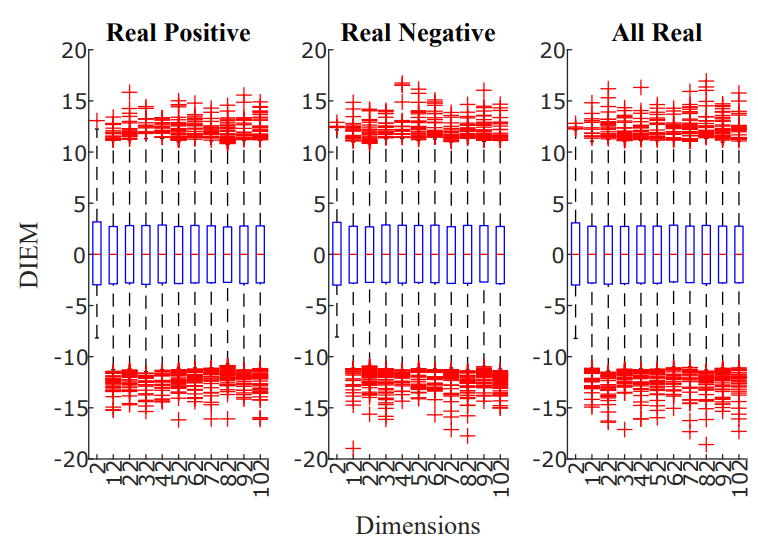
Figure 5: Dimension Insensitive Euclidean Metric (DIEM) for increasing dimension of the vectors a and b. The three panels show, respectively, the case in which vector elements were only positive (left), only negative (center) or could assume all real values within the given range (right).
Figure 5 logically follows, presenting the final DIEM metric, which is stable and centered around zero across all tested dimensions.
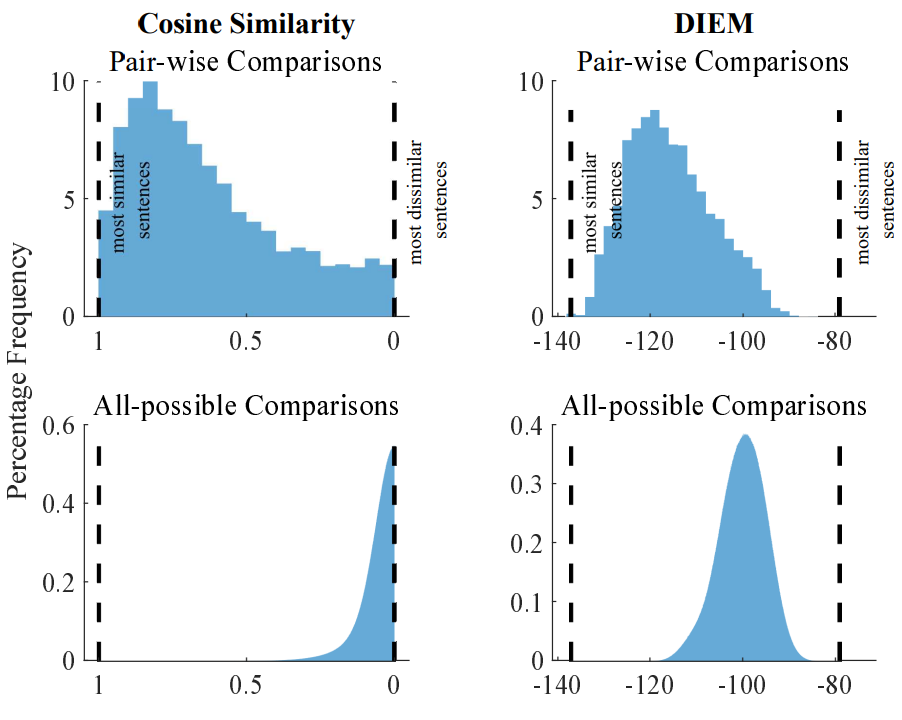
Figure 7: Histograms representing the similarity between text embeddings using cosine similarity (left column) and DIEM (right column) considering "pair-wise comparisons" (first row) or "allpossible comparisons". The histograms are normalized to the total number of samples. The vertical black dashed lines show the most similar and most dissimilar sentences (vector embeddings) in the whole dataset. The vectors embeddings could range over all real values but the cosine similarity was constrained between 0 and 1 as per Equation 1.
The practical utility of DIEM is powerfully illustrated in the LLM embedding case study (Figure 7). When comparing sentence embeddings from the all-MiniLM-L6-v2 model, the cosine similarity scores for a massive set of random pairs collapse into a narrow distribution around zero, making them statistically indistinguishable from the meaningful "pair-wise" similarities from the STS-B dataset. DIEM, however, maintains a broad, informative distribution, allowing a simple z-test to clearly separate the signal from the noise. This directly addresses a common problem in NLP and other fields where researchers need to determine if a given similarity score is statistically significant or merely a high-dimensional artifact.
Future Research Directions
The paper lays the groundwork for several interesting avenues of future research. The authors themselves suggest exploring the metric's performance with different underlying data distributions beyond the uniform distribution assumed in the derivations. While the metric proved robust in the case of normally-distributed sentence embeddings, its behavior with skewed or multi-modal distributions is an open question.
Another area for investigation is the application of DIEM to other domains where high-dimensional vectors are prevalent, such as genomics, climate science, or materials science. Each field has its own unique data characteristics and may require adaptations or further validation of the metric.
Finally, the relationship between DIEM and other dimensionality reduction techniques could be explored. Could DIEM be used as a diagnostic tool to determine the intrinsic dimensionality of a dataset, or could it be combined with methods like PCA or t-SNE to produce more meaningful low-dimensional visualizations?
Conclusion
DIEM is a pragmatic and statistically grounded replacement for cosine similarity when comparing unnormalized, high-dimensional vectors with known bounds. It preserves variance, provides stable comparisons across dimensions, and yields distributions that are approximately normal for
Definitions
Cosine Similarity: An angle-based similarity measure defined as . It is insensitive to vector magnitude and ranges from -1 to 1.
Euclidean Distance: The straight-line distance between two points, calculated as the L2 norm of their difference: .
DIEM (Dimension Insensitive Euclidean Metric): A detrended and variance-scaled Euclidean distance that is centered around 0 and maintains stable variance across dimensions.
Curse of Dimensionality: A term coined by Richard Bellman describing how the exponential growth of volume in high-dimensional spaces makes data sparse and distances less meaningful.
STS-B (Semantic Textual Similarity Benchmark): A dataset of 8,628 sentence pairs with human-annotated similarity scores, used for evaluating sentence embedding models ((Cer et al., 2017)).


Dimension-Insensitive Metrics: DIEM vs. Cosine Similarity In High Dimensions
Surpassing Cosine Similarity for Multidimensional Comparisons: Dimension Insensitive Euclidean Metric