For many organizations, extracting meaningful insights from raw business data is a challenging and time-consuming process. Endless spreadsheets and manual reporting can slow decision-making and frustrate users.
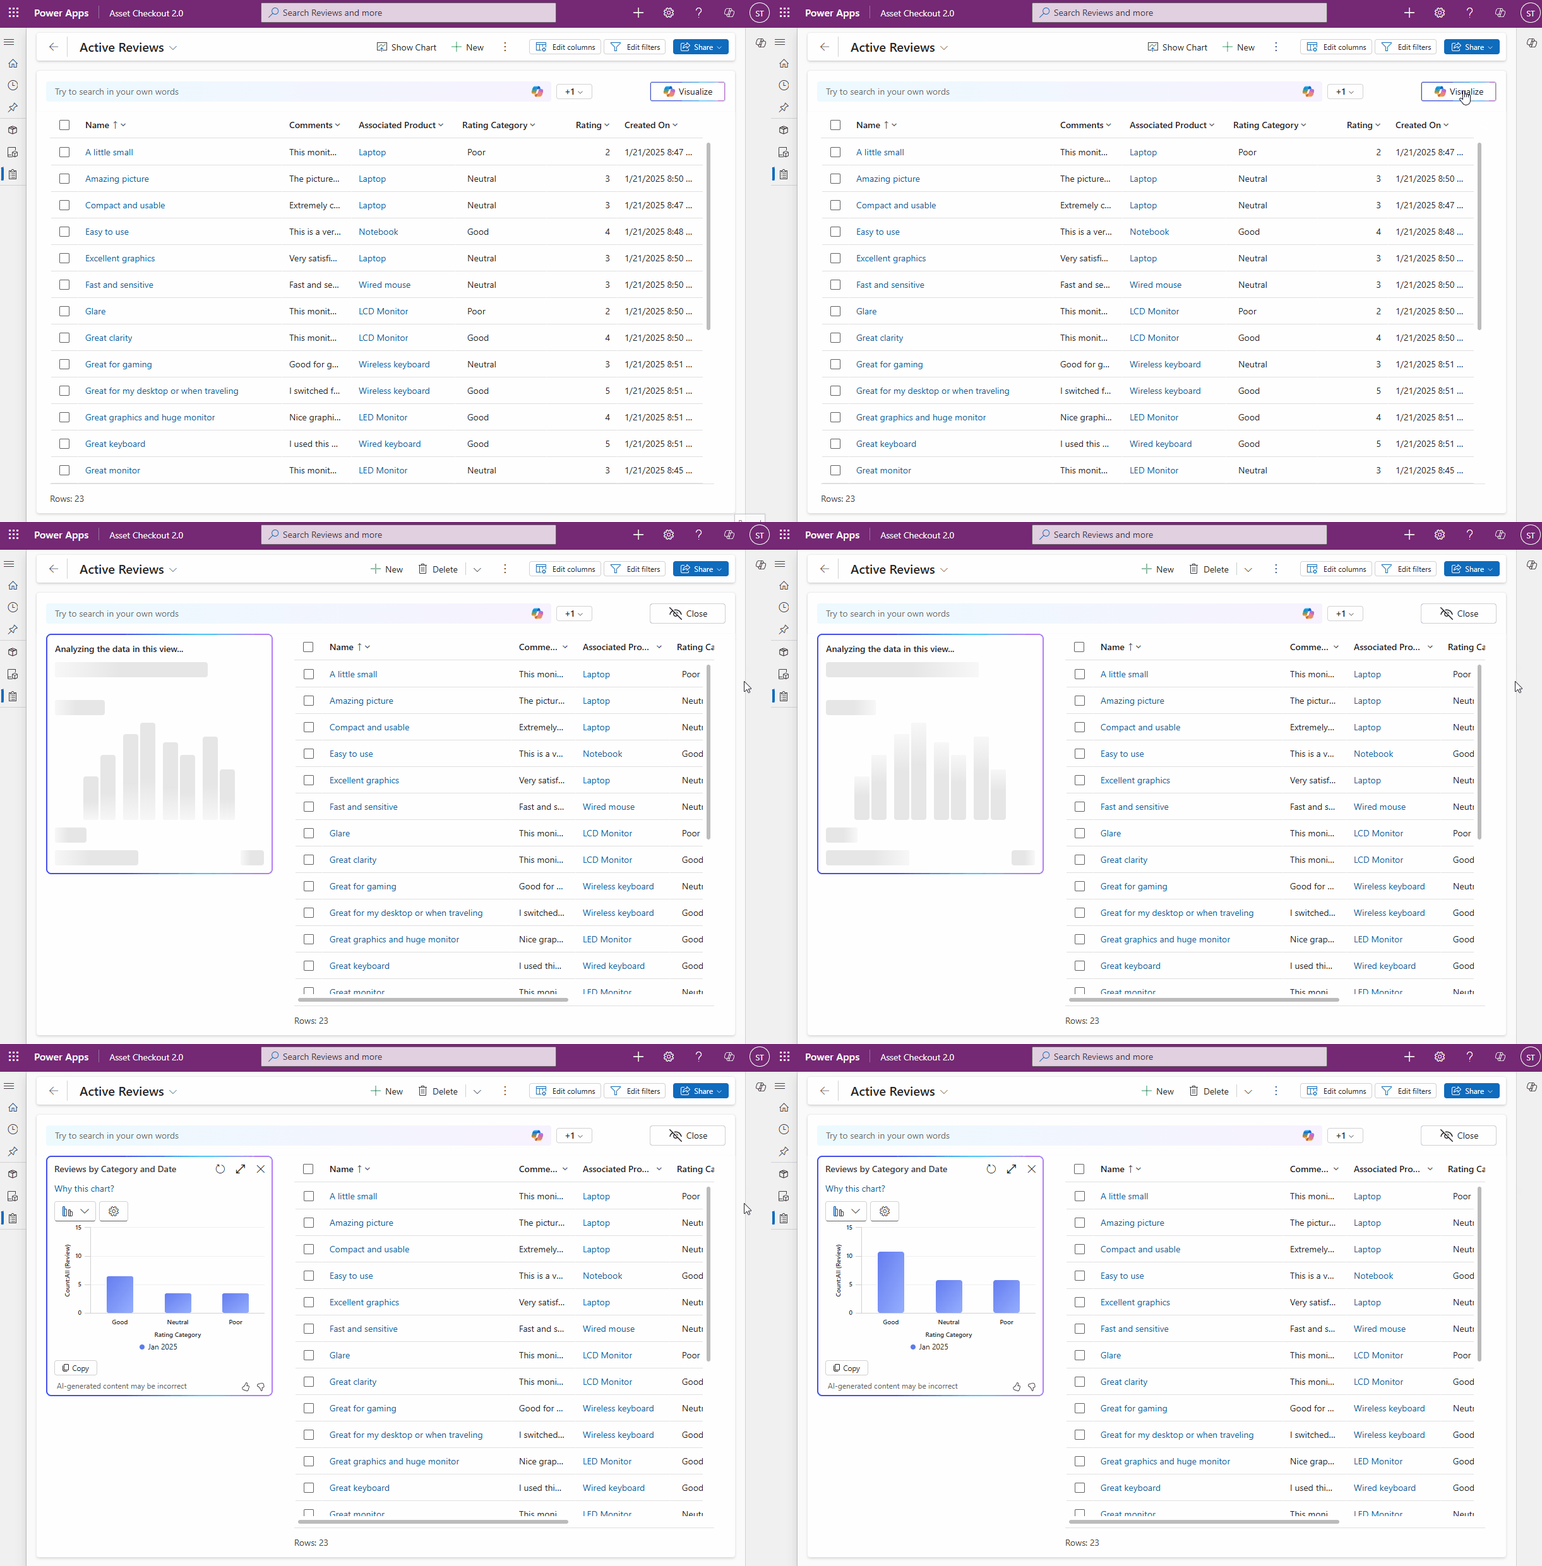
Visualize with Copilot, a new preview feature in Power Apps, that provides instant, interactive data visualizations at the click of a button. This innovation removes traditional barriers, allowing users to access the story behind their data quickly and efficiently.

Effortless Data Exploration
Historically, users spent considerable time exporting data, building custom reports, and applying filters before uncovering trends. The new data exploration agent in Power Apps streamlines this process.
By leveraging AI, users receive automatically generated charts, complete with descriptive titles and contextual explanations. This immediacy helps users grasp patterns and trends without the need for manual setup, transforming raw data into clear, actionable intelligence.
Customizable Visuals to Fit Your Needs
Flexibility is at the core of Visualize with Copilot. Users can easily tailor AI-generated charts to meet specific business needs. With just a few clicks, it’s possible to switch between chart types, adjust columns, or change aggregation methods.
This intuitive customization ensures that visualizations remain relevant and aligned with evolving business requirements. The result is a personalized data experience that supports more informed decision-making.
Interactive, Real-Time Analysis
Unlike static reports, the interactive visualizations delivered by Copilot stay connected to your data grid. Users can filter and drill down into specific data segments, uncovering deeper insights as they interact with the charts.
The introduction of natural language filtering further simplifies analysis, just type your query, and the system updates both the grid and the visualization instantly. This dynamic interplay makes it easier than ever to explore data and identify actionable opportunities.
Seamless Activation and Global Availability
Enabling Visualize with Copilot is a straightforward process for administrators. It requires activating two settings in the Power Platform Admin Center: natural language grid and view search, and AI-generated charts for data views. With rollout beginning on build 9.2.25013, the feature will be accessible to users worldwide by month's end, making advanced data visualization widely available.
Getting Started and Community Engagement
To support users during the preview phase, Microsoft offers comprehensive documentation and actively seeks feedback through their community forum. User insights gathered during this period will shape future enhancements, ensuring the feature evolves to meet real-world needs.
Conclusion
Visualize with Copilot represents a significant leap forward for organizations seeking to modernize their approach to data. By automating visualization and enabling real-time, interactive exploration, Power Apps bridges the gap between complex datasets and actionable business insights. For teams looking to unlock the full value of their data, this feature offers a smart, efficient way forward.

Unlocking Instant Data Insights: Visualize with Copilot in Power Apps